|
Visual Studio Code
|
|
Visual Studio Code is a source-code editor made by Microsoft for Windows, Linux and macOS.
Features include the support for debugging, syntax highlighting, intelligent code completion, snippets, code refactoring, and embedded Git.
VS Code can be downloaded from the official website:
|
|
Recommended VS Code extensions
|
|
1.Python (Pylance included) - a must-have extension that includes features such as IntelliSense (Pylance), linting, debugging, code navigation, code formatting, refactoring, variable explorer, test explorer, and more.
2.Code Spell Checker - a must-have basic spell checker.
3.autoDocstring - Python Docstring Generator - to quickly generate docstrings for python functions and classes.
4.Indent-Rainbow - a simple extension to make indentation more readable.
5.Python Indent - corrects Python indentation. |
|
Configure the debugger
|
|
1
|
Configure FASTSUITE Edition 2
|
|
1.1
|
Search for the file cenpyinit.py in the root folder of FASTSUITE and open it in a editor.
|
1.2
|
Enable the debugging by setting the flag:
enablePythonDebug = True
|
|
|
2
|
Configure Visual Studio Code
|
|
2.1
|
Make sure that Visual Studio Code has been installed properly
|
|
2.2
|
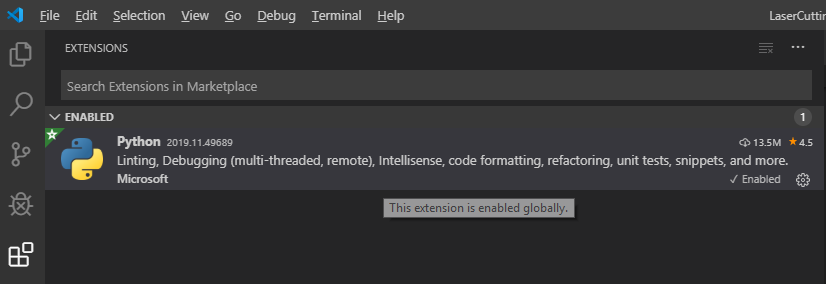
Run Visual Studio Code.
Verify that the Python extension has been installed. The extension can be found here:
|
|
2.3
|
Configure the Workspace of VSCode.
Add the Scripts folder(s) where to find the Python files that are to be debugged.

|
2.4
|
Open the Run and Debug menu and start the Add Configuration... command to add the debug configuration launch.json file.

The launch.json file will be created. Copy and paste the code below:
{
"version": "0.2.0",
"configurations": [
{
"name": "E2 debugpy",
"type": "debugpy",
"request": "attach",
"justMyCode": false,
"connect": {
"host": "localhost",
"port": 5254
},
"pathMappings": [
{
"localRoot": "${workspaceFolder}",
"remoteRoot": "${workspaceFolder}"
}
]
}
]
}

|
2.5
|
IntelliSense settings
In order to have IntelliSense working make sure that Python interpreter form E2 root folder is selected for current VS Code workspace.
This can be checked and set in right bottom of VS Code while python file is open.

Call Command Palette (Ctrl+Shift+P), write "workspace settings json" and press enter.

The new settings.json file will be added to .vscode folder inside your workspace. Copy and paste the code below:
{
"files.autoSave": "onFocusChange",
"editor.tabSize": 3,
"editor.detectIndentation": false,
"editor.renderWhitespace": "boundary"
}
Uncomment the specified line and replace the local E2 installation path. The default interpreter path should point to the Python executable from the desired E2 release:

As a result, the IntelliSense should be active:

|
|
|
|
|
3.1
|
Start FASTSUITE Edition 2 and load your scenario with the Python script(s).
|
3.2
|
If Python debugging is running for the first time, administrator permission will be requested.
Wait until the ptvsd message appears and then click the OK button.

Now the debugger is ready and can be attached.

It is only possible to attach the debugger after E2 runs a Python script for the first time.
|
3.3
|
Go to the Run and Debug menu in VSCode and press Start Debugging or use the F5 key on the keyboard.
The debug is active and the breakpoints in the Python script can be seen.

|
|
|
|